前言
atop是一个非常有用的工具,我已经记不清楚atop多少次帮助我定位到问题了。本文讲述,如果在极短的时间内,突然出现CPU load的飙升, 如何排查,可能是which process出现了异常。
当然了,情况可能有很多,比如,突然涌现了很多的进程,也可能是突然某个进程消耗大量的CPU,那么如何查看那个进程可能是嫌疑人呢。如何查看在某个时段,进程消耗的CPU情况呢。 atop就可以出场了。
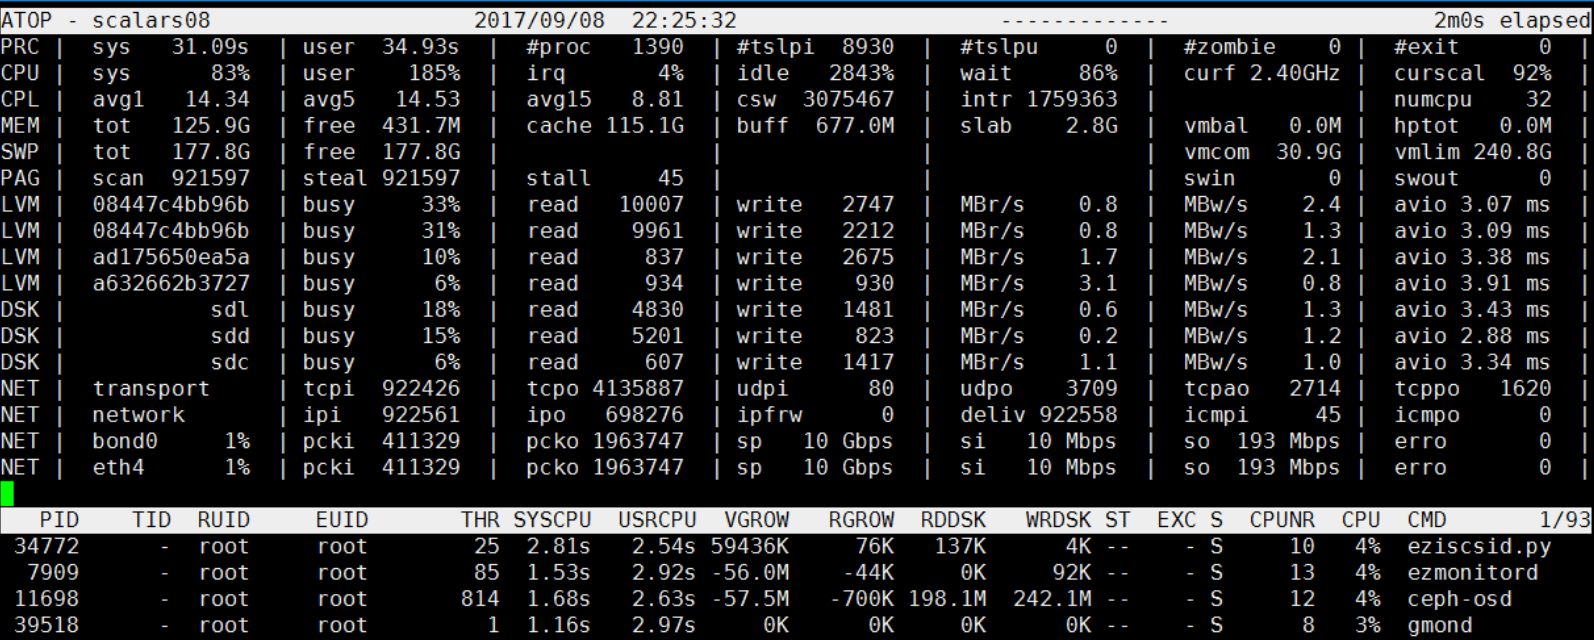
最近发现在晚上22:23分左右,CPU使用率过高,但是很快就会恢复正常了。
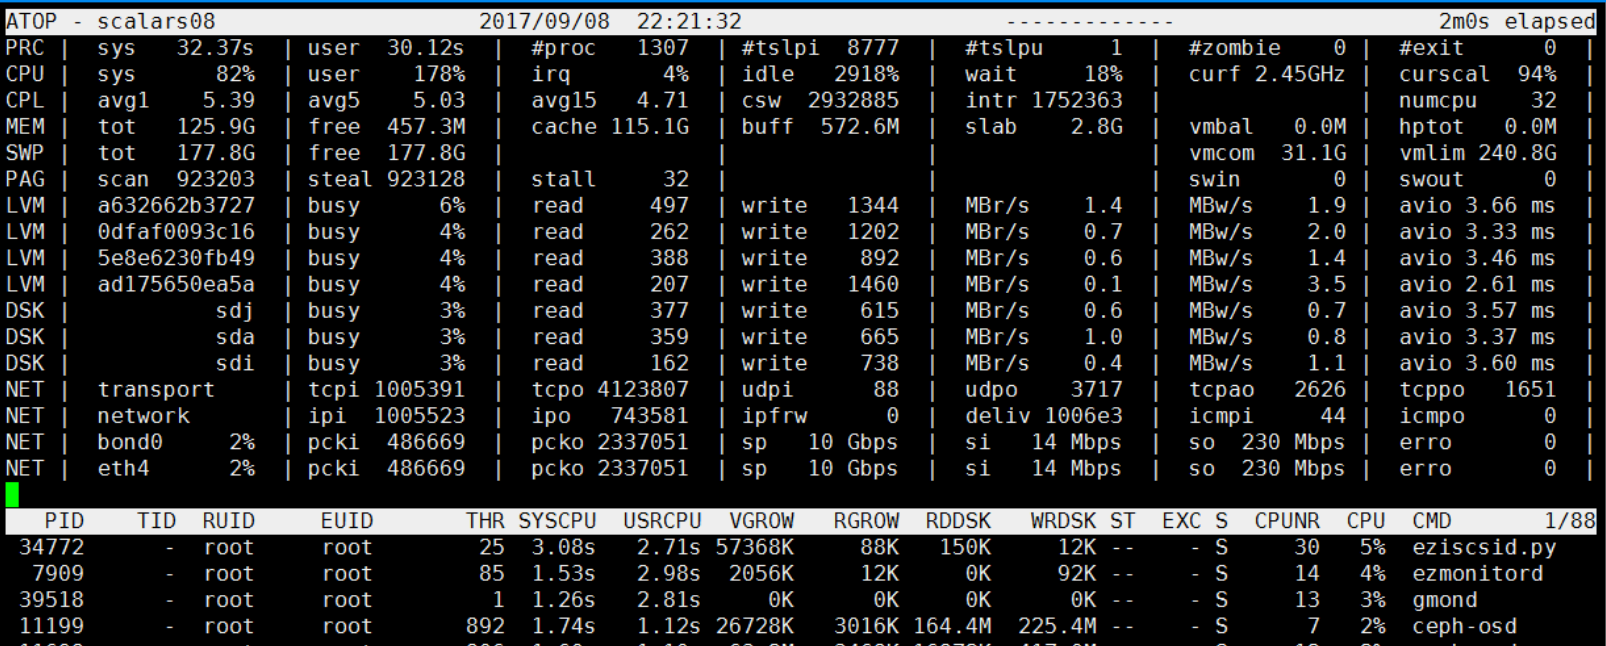
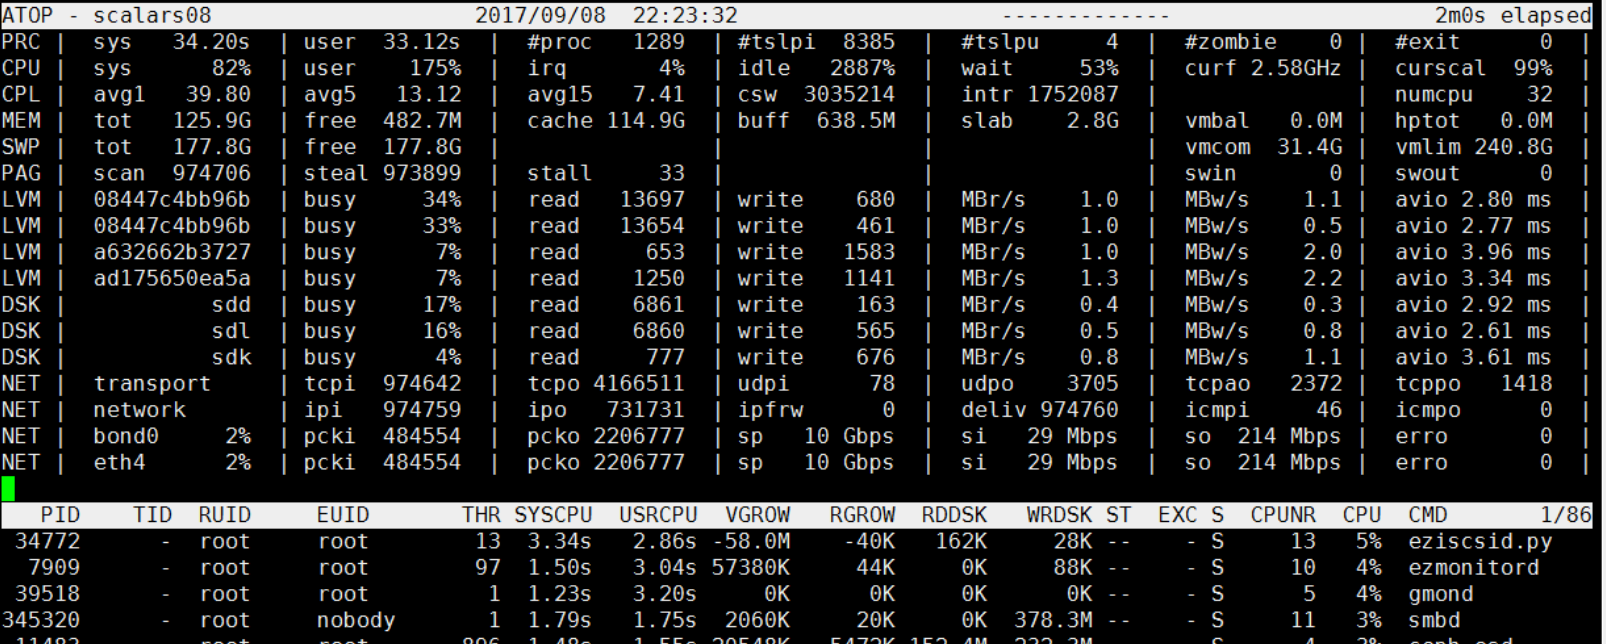
为什么关注22:23分 这个时间段,因为这个时间段出了点小意外。我们看22:21分的时候,过去1分钟的CPU负载 avg1 只是5.03 ,到了22:23分的时候,avg1 已经飙升到了39.80了。很快这个CPU飙升就消失了。
在22:23分附近 到底发生了什么?
使用atop排查谁消耗了最多的CPU资源
注意,atop有一个daemon,会记录下系统的各种信息,一旦某个时间段有故障,通过atop追溯当时的情况,发现引起故障的蛛丝马迹。
通过 atop -P PRC -b {begin_time} -e {end_time} -r atop.log 可以输出对应时间段的所以进程的CPU相关的信息。
比如可以通过如下指令观察昨天22:21~22:24分记录的信息:
atop -P PRC -b 22:21 -e 22:24 -r atop.log.1
注意输出长这个样子:
PRC scalars08 1504880492 2017/09/08 22:21:32 120 1 (init) S 100 16 4 0 120 0 0 13 0 1 y
PRC scalars08 1504880492 2017/09/08 22:21:32 120 2 (kthreadd) S 100 0 2 0 120 0 0 12 0 2 y
PRC scalars08 1504880492 2017/09/08 22:21:32 120 3 (ksoftirqd/0) S 100 0 9 0 120 0 0 0 0 3 y
PRC scalars08 1504880492 2017/09/08 22:21:32 120 5 (kworker/0:0H) S 100 0 0 -20 100 0 0 0 0 5 y
PRC scalars08 1504880492 2017/09/08 22:21:32 120 8 (rcu_sched) S 100 0 43 0 120 0 0 15 0 8 y
PRC scalars08 1504880492 2017/09/08 22:21:32 120 9 (rcu_bh) S 100 0 0 0 120 0 0 0 0 9 y
PRC scalars08 1504880492 2017/09/08 22:21:32 120 10 (migration/0) S 100 0 2 0 0 99 1 0 0 10 y
PRC scalars08 1504880492 2017/09/08 22:21:32 120 11 (watchdog/0) S 100 0 0 0 0 99 1 0 0 11 y
PRC scalars08 1504880492 2017/09/08 22:21:32 120 12 (watchdog/1) S 100 0 0 0 0 99 1 1 0 12 y
PRC scalars08 1504880492 2017/09/08 22:21:32 120 13 (migration/1) S 100 0 2 0 0 99 1 1 0 13 y
PRC scalars08 1504880492 2017/09/08 22:21:32 120 14 (ksoftirqd/1) S 100 0 8 0 120 0 0 1 0 14 y
PRC scalars08 1504880492 2017/09/08 22:21:32 120 16 (kworker/1:0H) S 100 0 0 -20 100 0 0 1 0 16 y
PRC scalars08 1504880492 2017/09/08 22:21:32 120 17 (watchdog/2) S 100 0 0 0 0 99 1 2 0 17 y
PRC scalars08 1504880492 2017/09/08 22:21:32 120 18 (migration/2) S 100 0 2 0 0 99 1 2 0 18 y
PRC scalars08 1504880492 2017/09/08 22:21:32 120 19 (ksoftirqd/2) S 100 0 8 0 120 0 0 2 0 19 y
PRC scalars08 1504880492 2017/09/08 22:21:32 120 21 (kworker/2:0H) S 100 0 0 -20 100 0 0 2 0 21 y
PRC scalars08 1504880492 2017/09/08 22:21:32 120 22 (watchdog/3) S 100 0 0 0 0 99 1 3 0 22 y
PRC scalars08 1504880492 2017/09/08 22:21:32 120 23 (migration/3) S 100 0 2 0 0 99 1 3 0 23 y
PRC scalars08 1504880492 2017/09/08 22:21:32 120 24 (ksoftirqd/3) S 100 0 8 0 120 0 0 3 0 24 y
PRC scalars08 1504880492 2017/09/08 22:21:32 120 26 (kworker/3:0H) S 100 0 0 -20 100 0 0 3 0 26 y
PRC scalars08 1504880492 2017/09/08 22:21:32 120 27 (watchdog/4) S 100 0 0 0 0 99 1 4 0 27 y
PRC scalars08 1504880492 2017/09/08 22:21:32 120 28 (migration/4) S 100 0 2 0 0 99 1 4 0 28 y
一堆数字,如何解读呢,看atop的手册:
    This  line  contains  the  total  cpu time consumed in system mode (`sys') and in user mode (`user'), the
    total number of processes present at this moment (`#proc'), the total number of threads present  at  this
    moment  in  state `running' (`#trun'), `sleeping interruptible' (`#tslpi') and `sleeping uninterruptible'
    (`#tslpu'), the number of zombie processes (`#zombie'), the number of clone system calls (`clones'),  and
    the number of processes that ended during the interval (`#exit', which shows `?' if process accounting is
    not used).
    If the screen-width does not allow all of these counters, only a relevant subset is shown.
我们以第一行为例解读输出
- PRC: 表示atop的PRC输出
- scalars08 主机名
- 1504880492 时间戳
- 2017/09/08 日期
- 22:21:32 时间
- 120 atop采样间隔,即120秒采样一次
- 1 进程ID
- init 进程名
- S 进程状态
- 100 每秒ticks,即100 ticks 每秒
- 16 用户态消耗的CPU ticks数
- 4 内核态消耗的CPU ticks数
blah blah 。。。
通过次数我们不难得到对应时间段内消耗CPU资源最多的进程,它很可能就是尖峰的罪魁祸首:
atop -P PRC -b 22:21 -e 22:24 -r atop.log.1 | awk '{print $8,$7,$19,$3,$4,$5, $11,$12, $11+$12}' |sort -nk 9
最后的的输出如下:
(ceph-mon) 9493 9493 1504880612 2017/09/08 22:23:32 152 77 229
(ceph-osd) 12181 12181 1504880492 2017/09/08 22:21:32 105 129 234
(ceph-osd) 11929 11929 1504880492 2017/09/08 22:21:32 109 126 235
(ceph-osd) 12181 12181 1504880612 2017/09/08 22:23:32 104 134 238
(ceph-mon) 9493 9493 1504880492 2017/09/08 22:21:32 161 79 240
(ceph-osd) 12297 12297 1504880492 2017/09/08 22:21:32 102 154 256
(ceph-osd) 11483 11483 1504880492 2017/09/08 22:21:32 100 157 257
(ceph-osd) 12063 12063 1504880492 2017/09/08 22:21:32 123 136 259
(ceph-osd) 11698 11698 1504880492 2017/09/08 22:21:32 110 160 270
(ceph-osd) 12297 12297 1504880612 2017/09/08 22:23:32 118 160 278
(ceph-osd) 11199 11199 1504880492 2017/09/08 22:21:32 112 174 286
(ceph-osd) 12063 12063 1504880612 2017/09/08 22:23:32 132 155 287
(ceph-osd) 11199 11199 1504880612 2017/09/08 22:23:32 136 157 293
(ceph-osd) 12413 12413 1504880612 2017/09/08 22:23:32 150 149 299
(ceph-osd) 11698 11698 1504880612 2017/09/08 22:23:32 143 159 302
(ceph-osd) 11483 11483 1504880612 2017/09/08 22:23:32 155 148 303
(smbd) 345320 345320 1504880612 2017/09/08 22:23:32 175 179 354
(gmond) 39518 39518 1504880492 2017/09/08 22:21:32 281 126 407
(gmond) 39518 39518 1504880612 2017/09/08 22:23:32 320 123 443
(ezmonitord) 7909 7909 1504880492 2017/09/08 22:21:32 298 153 451
(ezmonitord) 7909 7909 1504880612 2017/09/08 22:23:32 304 150 454
(eziscsid.py) 34772 34772 1504880492 2017/09/08 22:21:32 223 281 504
(eziscsid.py) 34772 34772 1504880612 2017/09/08 22:23:32 236 307 543
(eziscsid.py) 34772 34772 1504880492 2017/09/08 22:21:32 271 308 579
(eziscsid.py) 34772 34772 1504880612 2017/09/08 22:23:32 286 334 620
(gmond) 43505 43505 1504880612 2017/09/08 22:23:32 16252 8171 24423
(python) 8020 8020 1504880612 2017/09/08 22:23:32 43420 16328 59748
(ezfs-agent) 34567 34567 1504880612 2017/09/08 22:23:32 91905 95602 187507
通过上面最后一行,可以看出,毫无疑问,尖峰很可能是ezfs-agent引起的,事实上,这是孤例,但是其他时段的尖峰也是类似的,如下所示:
(ceph-osd) 10154 10154 1504838821 2017/09/08 10:47:01 554 923 1477
(ceph-osd) 10774 10774 1504838821 2017/09/08 10:47:01 617 860 1477
(ceph-osd) 10654 10654 1504838821 2017/09/08 10:47:01 614 884 1498
(ceph-osd) 9917 9917 1504838821 2017/09/08 10:47:01 602 1019 1621
(ceph-osd) 10274 10274 1504838821 2017/09/08 10:47:01 633 1020 1653
(ceph-osd) 10512 10512 1504838821 2017/09/08 10:47:01 668 993 1661
(ceph-osd) 10392 10392 1504838821 2017/09/08 10:47:01 586 1092 1678
(ceph-osd) 10036 10036 1504838821 2017/09/08 10:47:01 753 1052 1805
(gmond) 55762 55762 1504838821 2017/09/08 10:47:01 1539 631 2170
(ezmonitord) 7880 7880 1504838821 2017/09/08 10:47:01 1497 820 2317
(eziscsid.py) 53596 53596 1504838821 2017/09/08 10:47:01 1088 1353 2441
(eziscsid.py) 53596 53596 1504838821 2017/09/08 10:47:01 1344 1469 2813
(ceph-mon) 8185 8178 1504838821 2017/09/08 10:47:01 3060 290 3350
(smbd) 1002788 1002788 1504838821 2017/09/08 10:47:01 2041 3082 5123
(ceph-mon) 8178 8178 1504838821 2017/09/08 10:47:01 4609 1433 6042
(ezfs-agent) 53295 53295 1504838821 2017/09/08 10:47:01 65233 66407 131640
第二个例子中, 消耗CPU最多的进程,13万ticks,而第二名菜6400 ticks,是第二名的20倍。因此可以推断,ezfs-agent在对应时段发了疯,然后恢复了正常。它瞬间的发疯导致了尖峰的出现。