前言
blktrace和blkparse 这一对非常有用的工具,它可以跟踪Linux block层的I/O操作,我之前在ChinaUnix的博客中写过一篇文章介绍blktrace的使用,但是这个工具提供了大量的原始数据,很多高阶的工具都是基于blktrace和blkparse 提供的数据,进行处理,得到更高阶的数据或者统计。本文提到的ioprof是如此,seekwatcher工具也是如此。
本文我们介绍ioprof这个工具。
ioprof的安装
前言也介绍了,ioprof依赖 blktrace和blkparse,因此需要安装:
- blktrace
- blkparse
- fdisk
对于Ubuntu而言,只需要安装blktrace这个package即可:
sudo apt-get install blktrace
因为fdisk 在util-linux中,大部分发行版天生就支持fdisk命令:
root@62:/var/log# dpkg -S /sbin/fdisk
util-linux: /sbin/fdisk
如果想产生pdf格式的report,那么需要安装
- gnuplot
- pdf2latex
- terminal png
对应的package 如下:
sudo apt-get install gnuplot
sudo apt-get install texlive-latex-base
至于terminal png的话, 我看GIT的README介绍是需要png,但是阅读代码显示,需要的是pngcario,可以通过如下方法验证是否存在 terminal pngcario:
root@62:~/bean# gnuplot

	G N U P L O T
	Version 4.4 patchlevel 3
	last modified March 2011
	System: Linux 4.1.22-server

	Copyright (C) 1986-1993, 1998, 2004, 2007-2010
	Thomas Williams, Colin Kelley and many others

	gnuplot home:     http://www.gnuplot.info
	faq, bugs, etc:   type "help seeking-assistance"
	immediate help:   type "help"
	plot window:      hit 'h'

Terminal type set to 'wxt'
gnuplot> set terminal

Available terminal types:
           canvas  HTML Canvas object
              cgm  Computer Graphics Metafile

...
Press return for more:
           hpljii  HP Laserjet series II, [75 100 150 300]
             hppj  HP PaintJet and HP3630 [FNT5X9 FNT9X17 FNT13X25]
           imagen  Imagen laser printer
             jpeg  JPEG images using libgd and TrueType fonts
            latex  LaTeX picture environment
              lua  Lua generic terminal driver
               mf  Metafont plotting standard
              mif  Frame maker MIF 3.00 format
               mp  MetaPost plotting standard
          nec_cp6  NEC printer CP6, Epson LQ-800 [monocrome color draft]
          okidata  OKIDATA 320/321 Standard
              pbm  Portable bitmap [small medium large] [monochrome gray color]
             pcl5  HP Designjet 750C, HP Laserjet III/IV, etc. (many options)
         pdfcairo  pdf terminal based on cairo
              png  PNG images using libgd and TrueType fonts
         pngcairo  png based on cairo
       postscript  PostScript graphics, including EPSF embedded files (*.eps)
          pslatex  LaTeX picture environment with PostScript \specials

...
Press return for more:
            starc  Star Color Printer
              svg  W3C Scalable Vector Graphics driver
...
gnuplot>
一般安装gnuplot的时候,libcario2 和libcairo2-dev都会安装,不必太多担心。
一般来讲,要想支持pdf report,需要安装大量的debs,这对于服务器端是不太合理的,更合适的做法是从服务器端搜集数据,跑到自己的桌面端的Ubuntu来生成pdf,这样,这些包可以安装在自己的Desktop。事实上我就是这么做的。
解决完了依赖,最后是安装ioprof,其实ioprof一共只有4个文件,考虑到README和LICENSE,其实只有两个工作相关的文件:
- ioprof.py
- ioprof.pl
git clone还是直接拷贝,那都随意了。
ioprof能提供哪些信息
任何工具都是为了解决实际问题,必须要了解工具能提供哪些信息,了解工具的用处,才能够根据实际需要选择合适的工具。如果你手里只有一个锤子,那么看什么东西都是钉子。因此我们要掌握很多工具,并且灵活掌握它们的使用场景。
官方文档是这么说的:
- I/O Histogram - Great for determining size of hot data for SSD caching
- I/O Heatmap - Useful visualization to “see” where the hot data resides
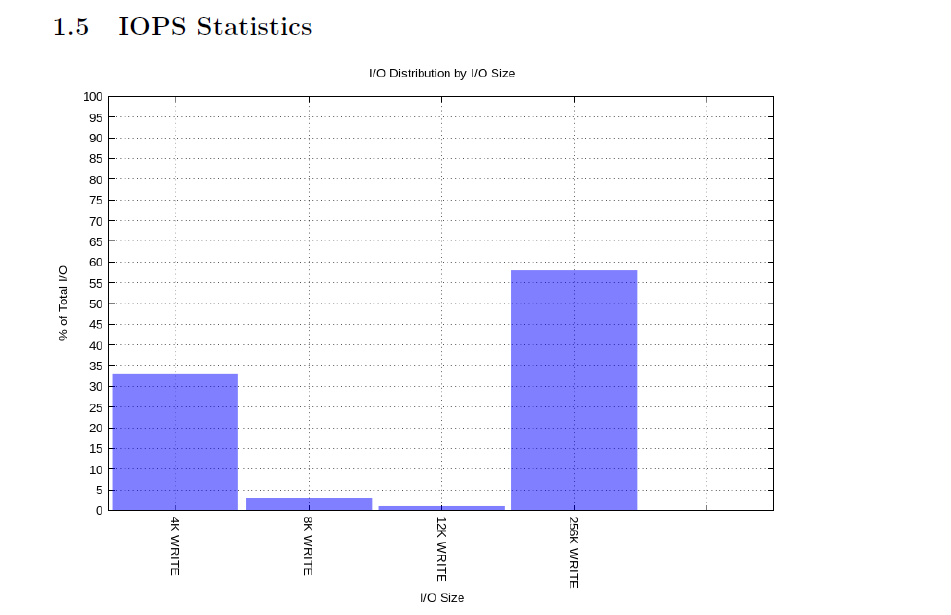
- I/O Size Stats - IOPS and bandwidth stats, which is useful for mixed workloads
- Top Files (opt) - Can ID top accessed files in EXT3/EXT4 filesystems
- Zipf Theta - An estimate of Zipfian distribution theta
I/O heatmap 比较好理解,输出是个图片,根据访问对应区域的次数显示出不同的颜色。可以清楚地看到访问最频繁的在位于块设备的那个区域。
另外就是io size的统计,提交给块设备的IO请求,可能是各种不同size的,可能是4K的io,也可能是256K的io,当然也可能是16K的io,该工具可以从次数角度统计这些io size 的次数,以及从size的角度统计各个io size总共的size(或读或写)。
通过长时间采集数据,得到的heatmap图可以看出,真正的热数据大概有多少。这样的话,如果需要增加cache,也能够准确地决定多大的SSD才是合适的。
当然其他的我就不太懂了,就不瞎说了。
ioprof的使用
运行和查看结果
首先不妨用fio测试下顺序读。
root@62:/data/osd.8/bean# fio --name=seqread --rw=read --bs=1M  --size=5G --runtime=400 --numjobs=10 --direct=1 --group_reporting
seqread: (g=0): rw=read, bs=1M-1M/1M-1M, ioengine=sync, iodepth=1
...
seqread: (g=0): rw=read, bs=1M-1M/1M-1M, ioengine=sync, iodepth=1
Starting 10 processes
seqread: Laying out IO file(s) (1 file(s) / 5120MB)
seqread: Laying out IO file(s) (1 file(s) / 5120MB)
seqread: Laying out IO file(s) (1 file(s) / 5120MB)
seqread: Laying out IO file(s) (1 file(s) / 5120MB)
seqread: Laying out IO file(s) (1 file(s) / 5120MB)
seqread: Laying out IO file(s) (1 file(s) / 5120MB)
seqread: Laying out IO file(s) (1 file(s) / 5120MB)
seqread: Laying out IO file(s) (1 file(s) / 5120MB)
seqread: Laying out IO file(s) (1 file(s) / 5120MB)
seqread: Laying out IO file(s) (1 file(s) / 5120MB)
Jobs: 2 (f=2): [R___R___E_] [59.1% done] [103M/0K /s] [101/0 iops] [eta 04m:38s] s]
seqread: (groupid=0, jobs=10): err= 0: pid=697090
  read : io=40222MB, bw=102941KB/s, iops=100, runt=400105msec
    clat (msec): min=21, max=1538, avg=125.33, stdev=39.32
    bw (KB/s) : min=  673, max=25404, per=8.44%, avg=8688.45, stdev=1215.33
  cpu          : usr=0.01%, sys=0.10%, ctx=40324, majf=0, minf=5664
  IO depths    : 1=100.0%, 2=0.0%, 4=0.0%, 8=0.0%, 16=0.0%, 32=0.0%, >=64=0.0%
     submit    : 0=0.0%, 4=100.0%, 8=0.0%, 16=0.0%, 32=0.0%, 64=0.0%, >=64=0.0%
     complete  : 0=0.0%, 4=100.0%, 8=0.0%, 16=0.0%, 32=0.0%, 64=0.0%, >=64=0.0%
     issued r/w: total=40222/0, short=0/0

     lat (msec): 50=37.80%, 100=31.34%, 250=24.46%, 500=5.32%, 750=0.84%
     lat (msec): 1000=0.18%, 2000=0.05%

Run status group 0 (all jobs):
   READ: io=40222MB, aggrb=102941KB/s, minb=105411KB/s, maxb=105411KB/s, mint=400105msec, maxt=400105msec

Disk stats (read/write):
  sdj: ios=161065/186269, merge=0/1393, ticks=15706776/324362808, in_queue=340071436, util=99.39%
同时另起终端运行ioprof
./ioprof.pl -m trace -d /dev/sdj -r 300
-d 用来指定跟踪的块设备。 -r 用来指定跟踪的时间。
跟踪完毕的时候,会有如下提醒:
FINISHED tracing: sdj.tar
Please use this file with ./ioprof.pl -m post -t sdj.tar to create a report
我们不妨看下ioprof能提供出哪些信息: 执行
./ioprof.pl -m post -t sdj.tar
./ioprof.pl (2.0.4)
Unpacking sdj.tar.  This may take a minute.
lbas: 3905945600 sec_size: 512 total: 1862.50 GiB
Time to parse.  Please wait...
Finished parsing files.  Now to analyze
Done correlating files to buckets.  Now time to count bucket hits.

--------------------------------------------
Histogram IOPS:
30.6 GB 100.0% (100.0% cumulative)
--------------------------------------------
Approximate Zipfian Theta Range: 0.6752-1.7771 (est. 1.1521).
Stats IOPS:
"256K READ" 99.43% (121233 IO's)
Stats BW:
"256K READ" 99.99% (29.60 GiB)
This heatmap can help you 'see' hot spots.  It is adjusted to terminal size, so each square = 476.00 MiB
The PDF report may be more precise with each pixel=1MB
Heatmap Key: Black (No I/O), white(Coldest),blue(Cold),cyan(Warm),green(Warmer),yellow(Very Warm),magenta(Hot),red(Hottest)
其heatmap因为牵扯到颜色,如下图所示:
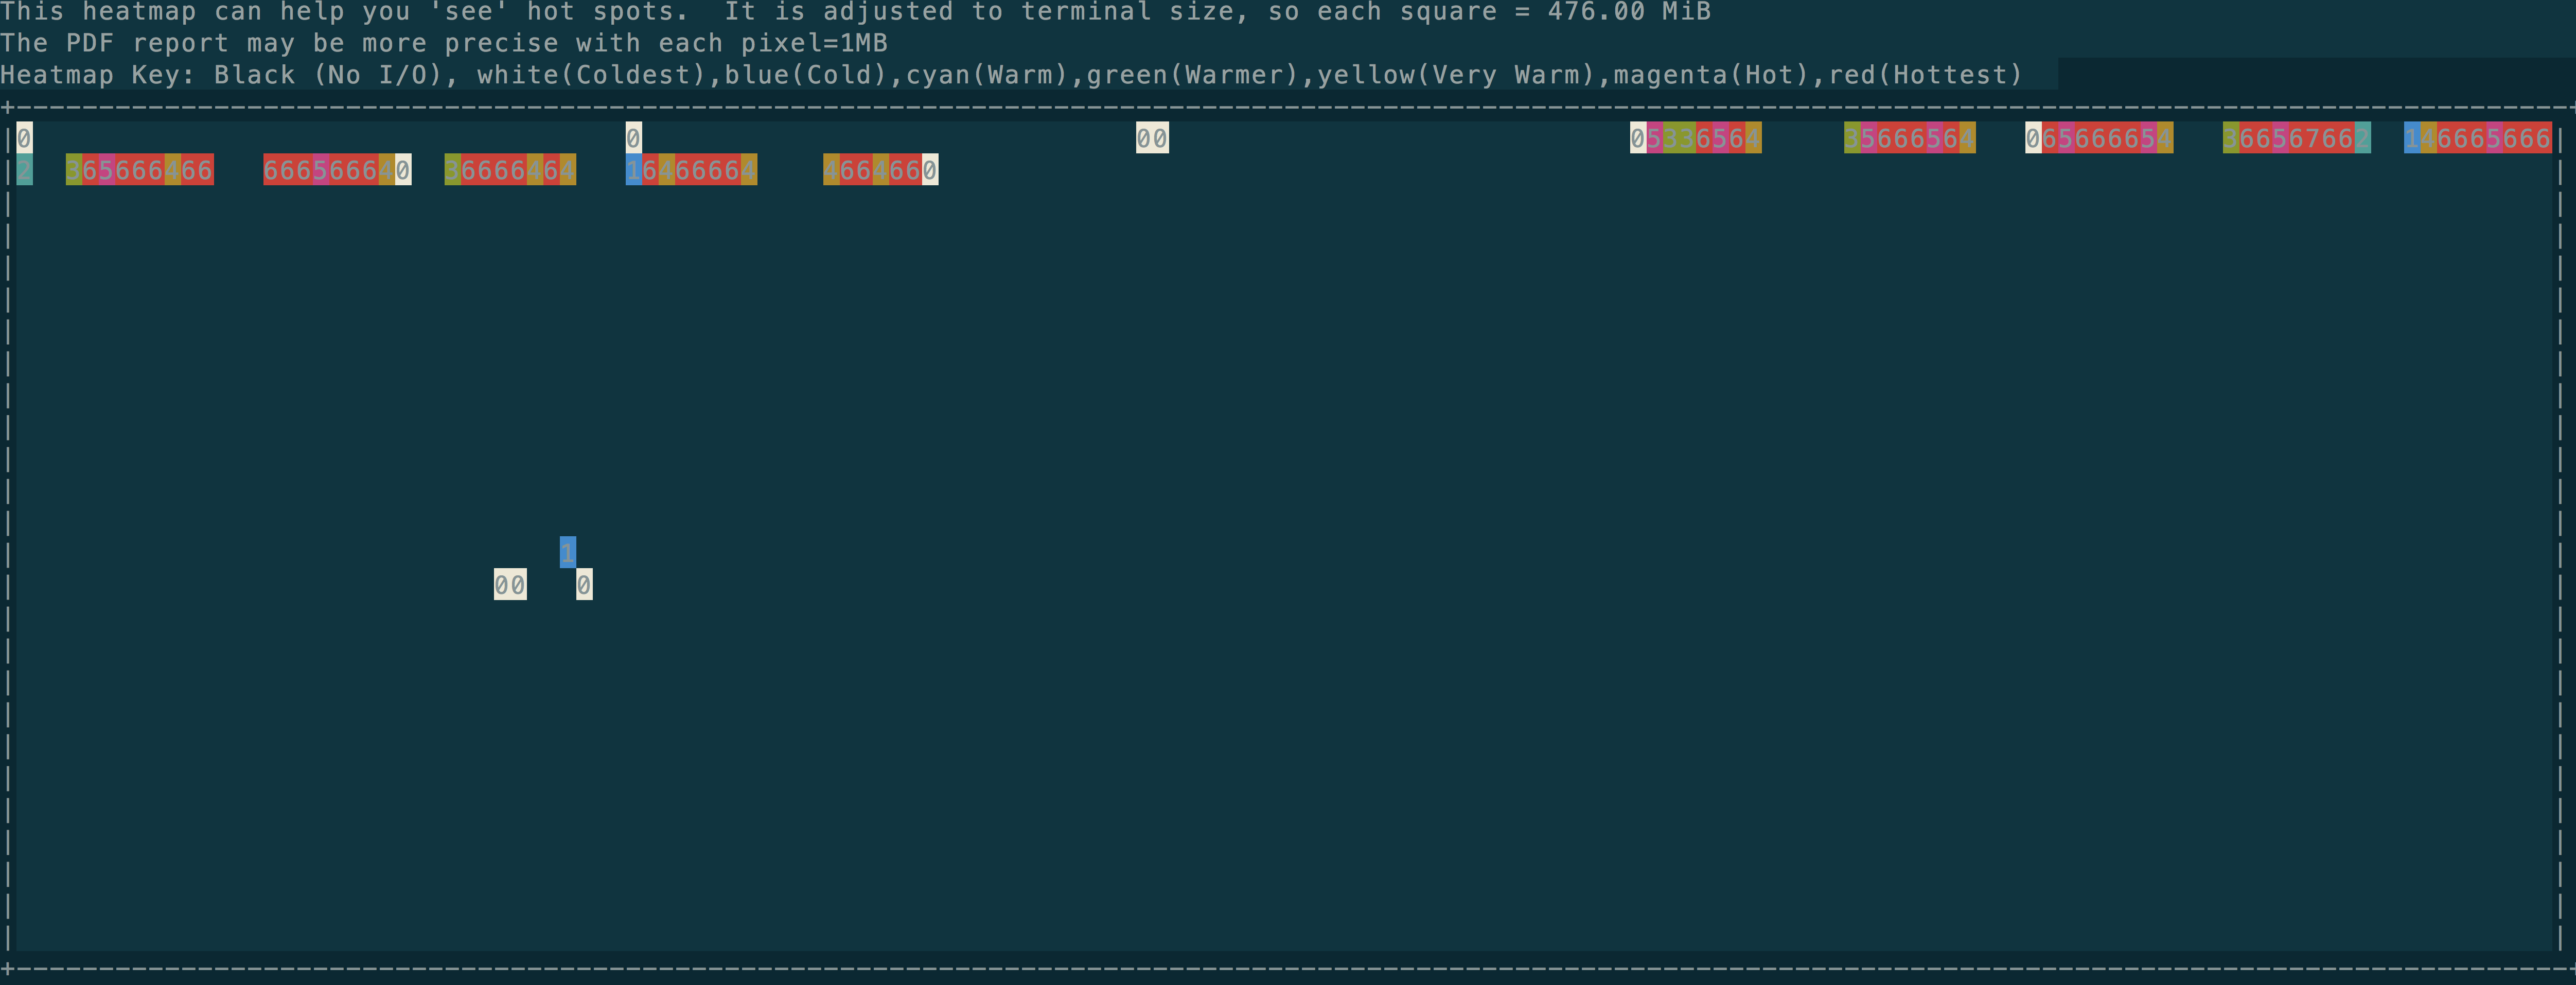
从上面输出我们可以看出不少东西,比如下发的几乎所有的IO都是256K的读,这和我们iostat命令看到的avgrq-sz总是512附近是一致的(iostat的单位是扇区,一个扇区是512字节,即256K):
(一个很有意思的话题是,为什么fio下发的bs是1M,但是文件系统下发给块设备却几乎总是256K,呵呵,此处先按下不表)
Device:         rrqm/s   wrqm/s     r/s     w/s    rMB/s    wMB/s avgrq-sz avgqu-sz   await r_await w_await  svctm  %util
sdj               0.00     0.00  422.00    0.00   105.50     0.00   512.00    39.07   96.25   96.25    0.00   2.37 100.00
产生 PDF report
使用ioprof可以产生PDF格式的report。 命令如下:
./ioprof.pl -m post -t sdj.tar -p
但是在我的Ubuntu上会有报错:
set terminal pngcairo enhanced font "arial,10" fontscale 1.0 size 800, 600
                                               ^
"header_heatmap.sdj.3905945600", line 1: unrecognized terminal option

ERROR: Failed to run gnuplot header_heatmap.sdj.3905945600 Error:  at ./ioprof.pl line 1096.
解决办法是将fontscale 1.0去掉即可。
会有如下内容的
更多的内容我就不贴图了。